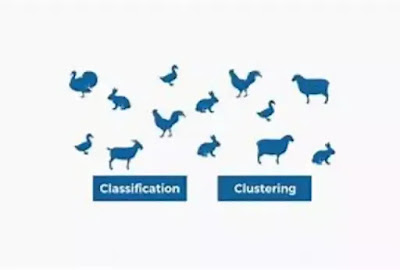
What is Hierarchical clustering

Unsupervised Learning Algorithm - Hierarchical Clustering

Hierarchical clustering Concepts

Hierarchical clustering is a popular unsupervised machine learning algorithm used to cluster or group similar data points together in a dataset. Hierarchical clustering does not need the user to predetermine the number of clusters, in contrast to K-Means clustering. The algorithm works by creating a hierarchy of clusters, where each data point initially forms its own cluster, and clusters are successively merged based on their similarity.

Here is an example of how Hierarchical clustering works: Suppose we have a dataset of customer transactions, where each transaction includes the customer's age, income, and spending behaviour. We want to group customers with similar spending behaviour together for targeted marketing campaigns. We use Hierarchical clustering to create a hierarchy of clusters based on the similarity of their spending behaviour. The algorithm initially assigns each customer to their own cluster and then successively merges clusters based on their similarity until a stopping criterion is met.

to cluster or group similar data points together in a dataset.

Hierarchical clustering Algorithm

  • Define the problem and collect data.
  • Choose a linkage method (e.g., complete linkage, single linkage, average linkage).
  • Compute the distance matrix between all data points.
  • Group the closest data points into a cluster.
  • Compute the distance between clusters based on the chosen linkage method.
  • Repeat the previous two steps until all data points belong to one cluster or until the desired number of clusters is reached.
  • Evaluate the model on a test dataset to estimate its performance.

Here is a sample Python code for the Hierarchical clustering algorithm using the Scipy library:

python code

< style="border: none; margin: 0px 0px 0px 40px; padding: 0px; text-align: left;">

from scipy. cluster. hierarchy import dendrogram, linkage

from sklearn. datasets import make_blobs

import matplotlib. pyplot as plt

# Generate sample data

X, y = make_blobs(n_samples=100, centers=3, random_state=42)

# Create a linkage matrix

link_matrix = linkage(X, method='ward')

# Plot dendrogram

dendrogram(link_matrix)

plt.show()

Benefits of Hierarchical Clustering Algorithm: 

  • Can create a hierarchy of clusters for a better understanding of the data.
  • It can help in identifying patterns and relationships within the data. 
  • does not require the prior specification of the number of clusters
  • Can be used for anomaly detection and identification.

Advantages of Hierarchical Clustering Algorithm: 

  • The algorithm can handle noisy data and outliers.
  • The algorithm can handle datasets of any shape or size.
  • The algorithm can provide insights into the data structure and patterns.
  • The algorithm can be used for data compression and speeding up computation.

Disadvantages of Hierarchical Clustering Algorithm: 

  • For large datasets, the approach may be computationally expensive.
  • The algorithm may not work well for high-dimensional data.
  • The interpretation of the dendrogram may be subjective.
  • The algorithm may not be suitable for datasets with categorical variables.

Main Contents (TOPICS of Machine Learning Algorithms) 


                                                                  CONTINUE TO (Apriori algorithm)

Comments

Popular posts from this blog

Learn Machine Learning Algorithms

Machine Learning Algorithms with Python Code Contents of Algorithms  1.  ML Linear regression A statistical analysis technique known as "linear regression" is used to simulate the relationship between a dependent variable and one or more independent variables. 2.  ML Logistic regression  Logistic regression: A statistical method used to analyse a dataset in which there are one or more independent variables that determine an outcome. It is used to model the probability of a certain outcome, typically binary (yes/no). 3.  ML Decision trees Decision trees: A machine learning technique that uses a tree-like model of decisions and their possible consequences. It is used for classification and regression analysis, where the goal is to predict the value of a dependent variable based on the values of several independent variables. 4.  ML Random forests Random forests: A machine learning technique that uses multiple decision trees to improve the accuracy of predictions. It creates a f

What is Linear regression

Linear regression A lgorithm Concept of Linear regression In order to model the relationship between a dependent variable and one or more independent variables, linear regression is a machine learning algorithm. The goal of linear regression is to find a linear equation that best describes the relationship between the variables. Using the values of the independent variables as a starting point, this equation can then be used to predict the value of the dependent variable. There is simply one independent variable and one dependent variable in basic linear regression. The linear equation takes the form of y = mx + b, where y is the dependent variable, x is the independent variable, m is the slope of the line, and b is the y-intercept. For example, let's say we have a dataset of the number of hours studied and the corresponding test scores of a group of students. We can use linear regression to find the relationship between the two variables and predict a student's test scor

What is Decomposition Algorithm

Singular Value Decomposition Algorithms Singular Value Decomposition concepts Singular Value Decomposition (SVD) is a matrix factorization technique used in various machine learning and data analysis applications. It decomposes a matrix into three separate matrices that capture the underlying structure of the original matrix. The three matrices that SVD produces are:   U: a unitary matrix that represents the left singular vectors of the original matrix. S: a diagonal matrix that represents the singular values of the original matrix. V: a unitary matrix that represents the right singular vectors of the original matrix. Here is an example of how SVD works : Suppose we have a matrix that represents the ratings of users for different movies. We can use SVD to decompose this matrix into three separate matrices: one matrix that represents the preferences of users, one matrix that represents the importance of each movie, and one matrix that captures the relationship between users and m

What is Logistic regression

Logistic Regression  Algorithm Concept of Logistic Regression A machine learning approach called logistic regression is used to model the likelihood of a binary outcome based on one or more independent factors. The goal of logistic regression is to find the best-fitting logistic function that maps the input variables to a probability output between 0 and 1. The logistic function, also known as the sigmoid function, takes the form of:   sigmoid(z) = 1 / (1 + e^-z)   where z is a linear combination of the input variables and their coefficients. For example, let's say we have a dataset of customer information, including their age and whether they have purchased a product. We can use logistic regression to predict the probability of a customer making a purchase based on their age. Logistic Regression  Algorithm: Define the problem and collect data. Choose a hypothesis class (e.g., logistic regression). Define a cost function to measure the difference between predicted and actual

What is Naive Bayes algorithm

Naive Bayes Algorithm with Python Concepts of Naive Bayes Naive Bayes is a classification algorithm based on Bayes' theorem, which states that the probability of a hypothesis is updated by considering new evidence. Since it presumes that all features are independent of one another, which may not always be the case in real-world datasets, it is known as a "naive". Despite this limitation, Naive Bayes is widely used in text classification, spam filtering, and sentiment analysis. Naive Bayes Algorithm Define the problem and collect data. Choose a hypothesis class (e.g., Naive Bayes). Compute the prior probability and likelihood of each class based on the training data. Use Bayes' theorem to compute the posterior probability of each class given the input features. Classify the input by choosing the class with the highest posterior probability. Evaluate the model on a test dataset to estimate its performance. Here's an example code in Python for Naive Bayes: Python cod